Getting started with DreamTai
I am assuming that you have installed DreamTai and know how to start DreamTai software.
If you need Help at any point of time, select "Help"=>"Help Topics" from the DreamTai menu. This will bring up the "Help" web page. If you still have questions, please contact sales@dreamtai.com for answers.
Step 1
Start the program DreamTai program window will come up. You will see the Welcome screen.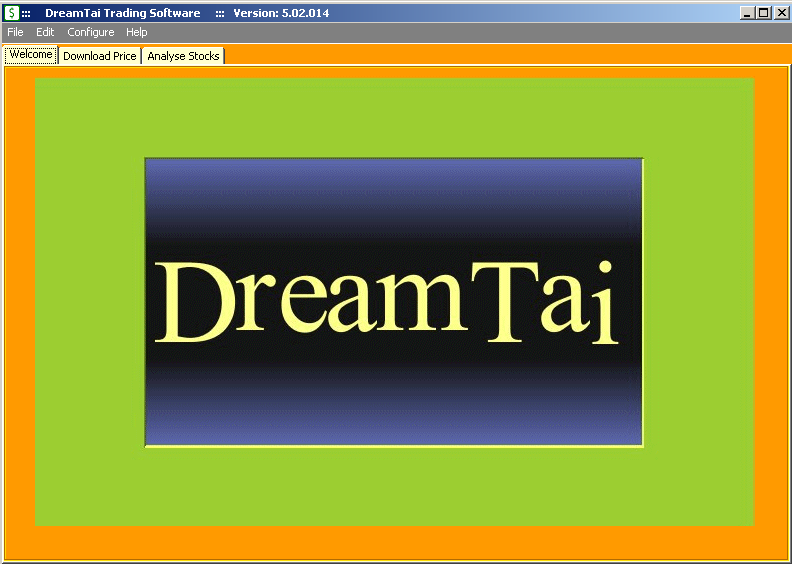
There are three tabs here:
1. Welcome Tab
2. Download price Tab and
3. Analyse Stocks Tab
Step 2
First of all, we will configure DreamTai based on our preferences.
Firewall proxy configuration
If you are working using your home internet then you can skip this step.
If you are using the internet from your office, then you have to configure DreamTai so that it is able to go through the corporate firewall.
Refer the following article to configure the firewall proxy settings. CLICK HERE
Initial Capital Setting
DreamTai sets the number of shares to buy/sell per trade such that you do not risk more than two percent of your total capital per trade.
You have to set the initial capital to get the correct amount to risk per trade. Otherwise, DreamTai will assume that you have 100,000 (dollars/ pounds/whatever currency you use) as the initial capital.
Refer the following article to configure the initial capital setting. CLICK HERE
Chart Color Settings
DreamTai shows the "Buy" signal as a green bar in the stock chart. It shows the "Sell" signal as a red bar.
If you want to set the buy/sell signal colors to some other color, say blue you can change it using the Chart color settings.
Refer the following article to configure the chart bar color settings. CLICK HERE
Downloading Stock data from the internet
Select the "Download Price" Tab. You will notice that there are 20 watchlists. You will also notice a LOAD button which is grayed out at present.
Each watchlist comes with some default stocks. You can add/delete stocks from the watchlist. The stocks you have added/deleted to the watchlist will be saved for the next session. You can store as many symbols as you want in each watchlist. However, you can only load one watchlist during each session. If you need to switch to another watchlist, you have to stop and re-start DreamTai and select the new watchlist.
Let us begin with selecting a watchlist.
Select watchlist 2 from the list. You will notice that the LOAD button at bottom has been enabled.
Make sure that you are connected to the internet, if you want to download new data for the stocks.
Click on the LOAD button.
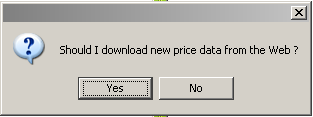
A window will pop up asking "Should I download new data from the web?"
If you had already loaded data for the day, you can just click on NO. DreamTai will use the data which has been downloaded previously.
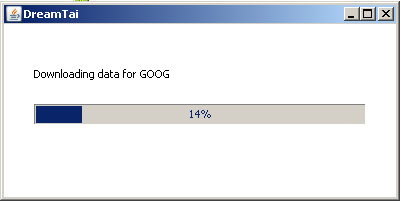
If you click on YES, DreamTai will connect to the internet and download data from Yahoo Finance. You should see a progressbar showing the progress of the download from 0 percent to 100 percent.
NOTE:
If you do not see the progress bar, it means that DreamTai can not connect to the internet.
Check if the anti-spy ware software, anti-virus software or firewall software on your computer is blocking DreamTai from accessing the internet.
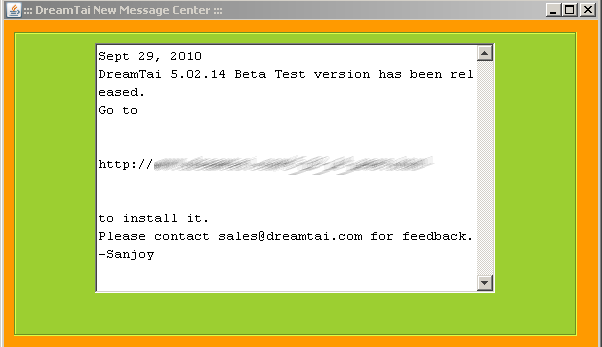
If there is some new message like announcement about release of new version of DreamTai, you should see a message center window pop up, as shown in the figure below.
After DreamTai downloads the data, it will do calculations, which may take some time. Then, it will open a browser window showing all the stocks in the watchlist and their Power Rankings.
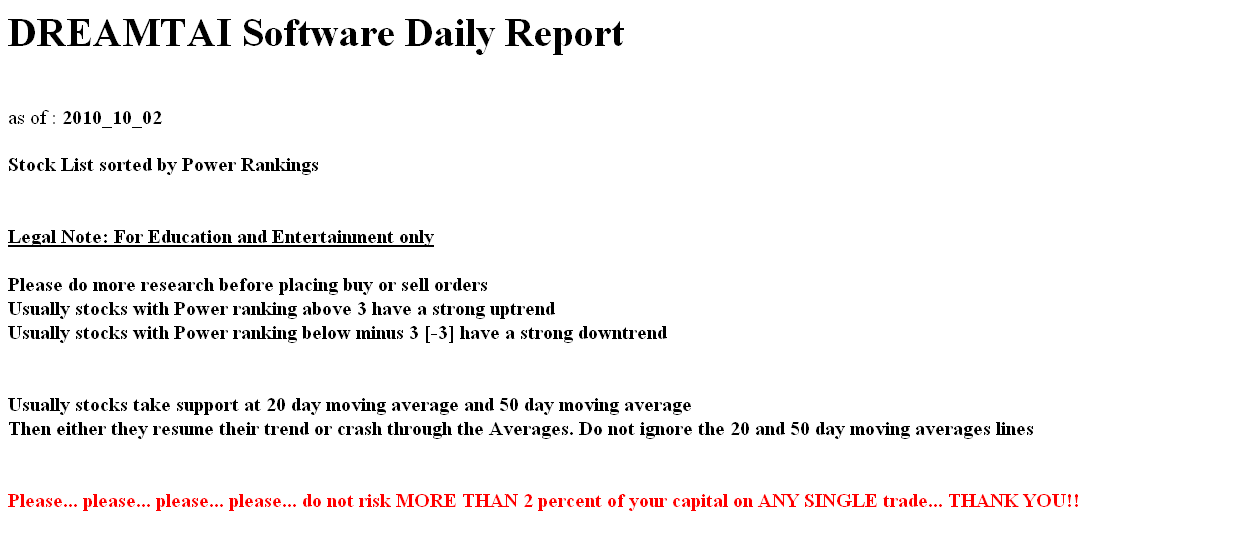
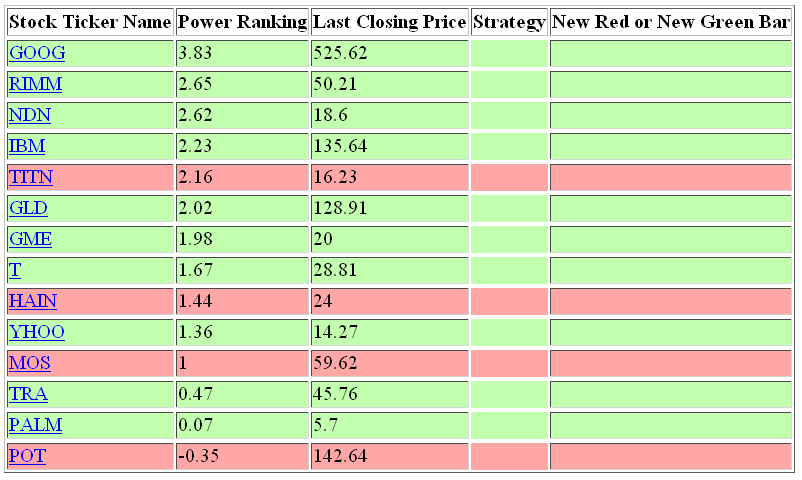
Those rows which are in Green color background have buy signal. Those rows which are in Red color background have sell signal.
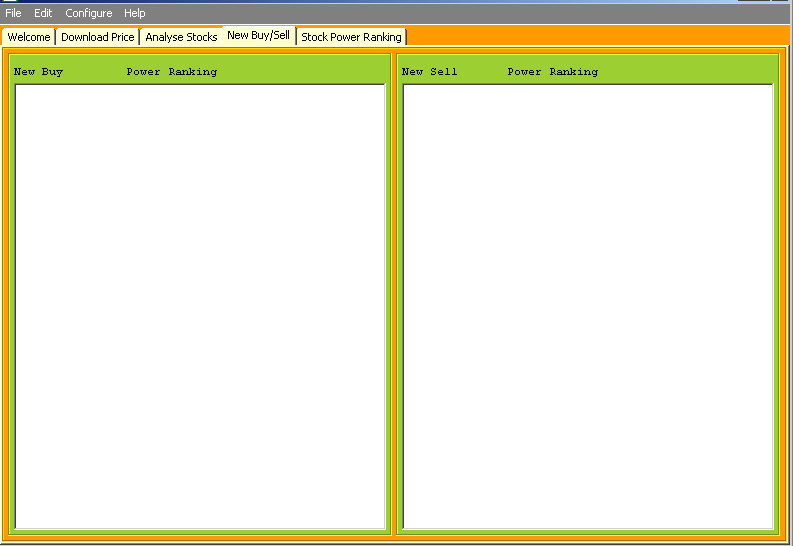
New Buy/Sell Tab
You will notice that there are two new tabs created: "New Buy/Sell" and "Stock Power Ranking"
The "New Buy/Sell" tab will show those stocks whose signal has changed from bullish to bearish.
Some days, there are no signal changes, so this tab will not display any stock ticker.
Power Ranking Tab
The "Stock Power Ranking" shows all the stocks listed based on the Power Ranking. The most bullish stocks are on the top and the most bearish stocks are on the bottom.
The bearish stocks have negative power ranking.
As a thumb rule, if a stock has Power Ranking more than 3 then there is a lot of buying power and many buyers are after this stock.
If a stock has a Power Ranking of -3 or less, it means that the stock has lots of selling power and many holders of this stock are selling this stock.
Analyse Stock Tab
Now, click on the "Analyse Stock" tab. You will see all the stocks listed in a selection box on the left hand side. Select any stock and the chart of this stock is shown on the right hand side.
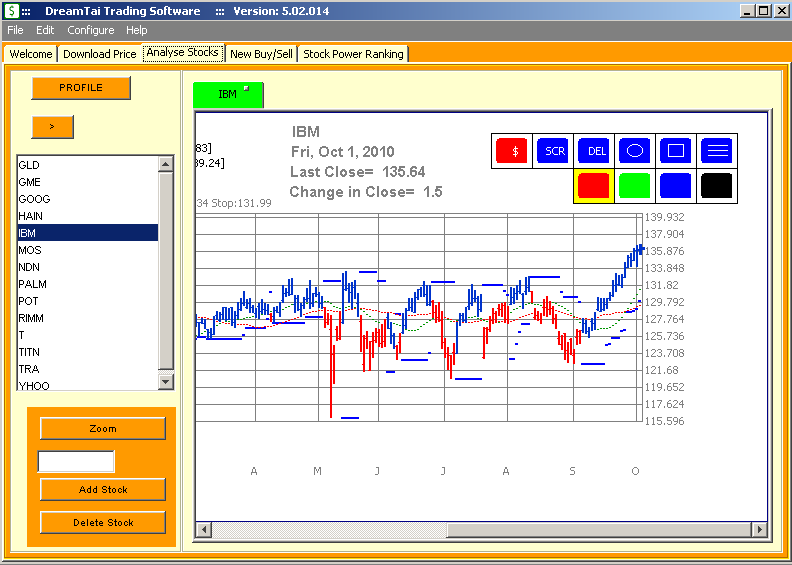
Stock Chart
If you select any other stock in the list, then a new chart tab displaying the selected stock is created.
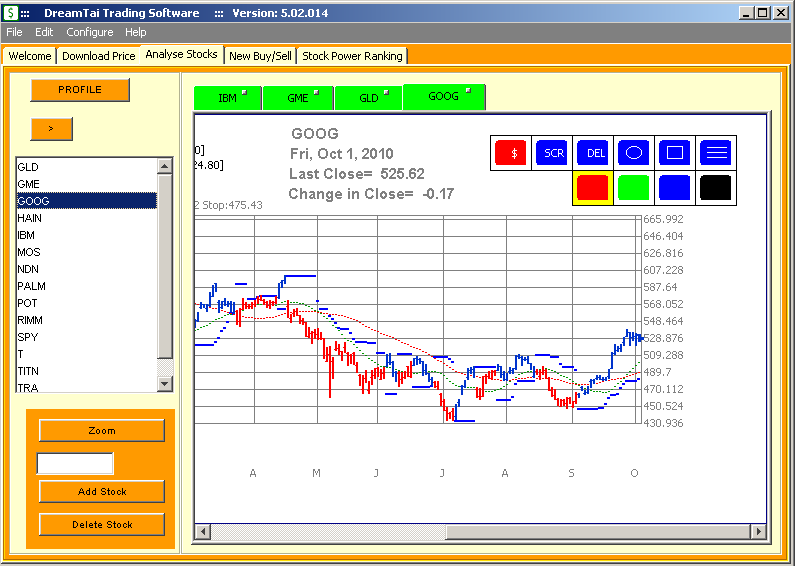
Each chart tab has a small button. If you click on that button, that chart window will close.

How to Add a stock.
Suppose we want to add the Standard and Poors Depository ETF. If you look in Yahoo Finance (http://finance.yahoo.com), the symbol for this is SPY.
So, enter the ticker symbol SPY in the text box below the ZOOM button and click on the ADD STOCK button. DreamTai will go to internet and fetch data for SPY and then add it to the list.
How to Delete a stock
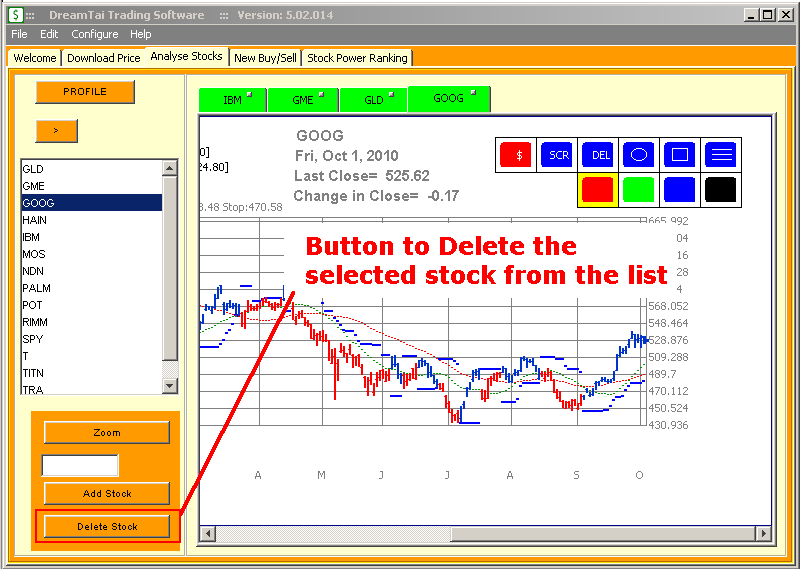
Select a stock from the list on the left hand side.
Then click on DELETE STOCK button. The stock will be removed from that watchlist and also removed from the list.
How to Zoom a stock chart
If you want to examine a stock chart in detail, click on the ZOOM button. A new window with expanded stock chart will be displayed. You can close this window to go back to the original chart.
Description of the chart buttons
On each chart, you will see different buttons.

1. Donate button
If you make profits and wish to contribute to the future development, please click on Donate button. This will bring up a webpage with PayPal button. You can pay through PayPal. Thanks a lot for contributing to future developmental efforts.2.Screenshot button
If you needed to take a screenshot of the chart, click on the SCR button. DreamTai will take a screenshot of the chart and save it.
The location where DreamTai saves the file is displayed in a pop up window.
3. Color Selection button
These buttons are used to select the color for any drawing you do. For example, if you want to draw a red trend line, you click on the red button and then click on the trendline button to draw a red trendline.
Later, if you want to change the color to green, just click on the green color button and then draw the trendline in green color.
The color change will impact drawing of all the trend lines, circles and Fibonacci rectangle drawing.
3. Circle button
The Circle tool is used to highlight important points in the chart.
Suppose you want to highlist all the peaks in the chart.
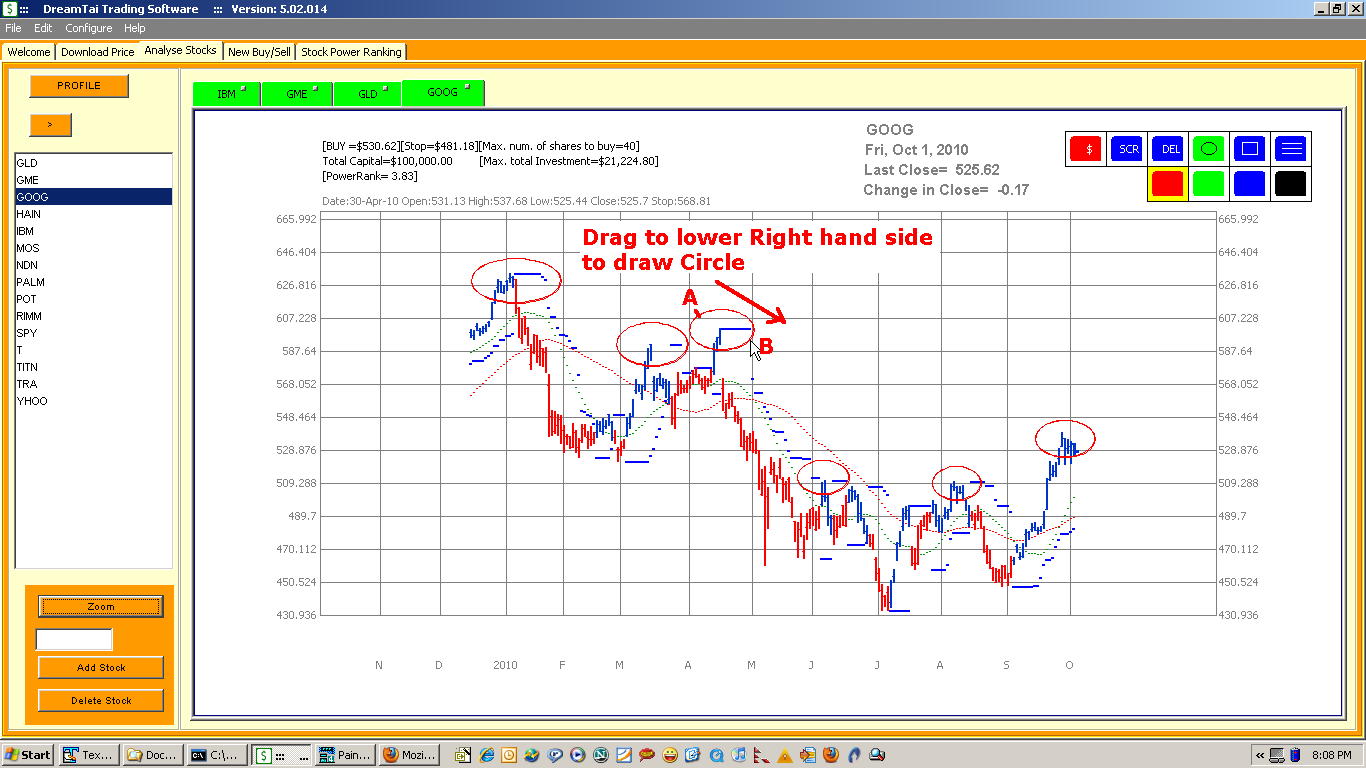
Click on the Blue color selection button to select blue color. We want to draw blue circles. Then click on the Circle button.
Then click near the top left point where you want to draw the circle and drag the mouse to the lower right hand side to draw a circle of appropriate size.
Assignment: Draw circles on all the peaks. Try drawing circles of different colors by selecting different colors from the color selection button.
4. Delete Drawing button
This tool is used to undo the drawing you have made on the chart.Assignment:
This assumes that you had drawn circles using the CIRCLE tool on all peaks of the chart.
Click on the DEL button. You will notice that the last circle you had drawn has been erased. Keep on clicking the DEL button to undo the circles you had drawn previously.
5. Trendline button
This button is used to draw the Trendlines at the support and resistance points.. In the figure below, trend lines are drawn at support and resistance points.,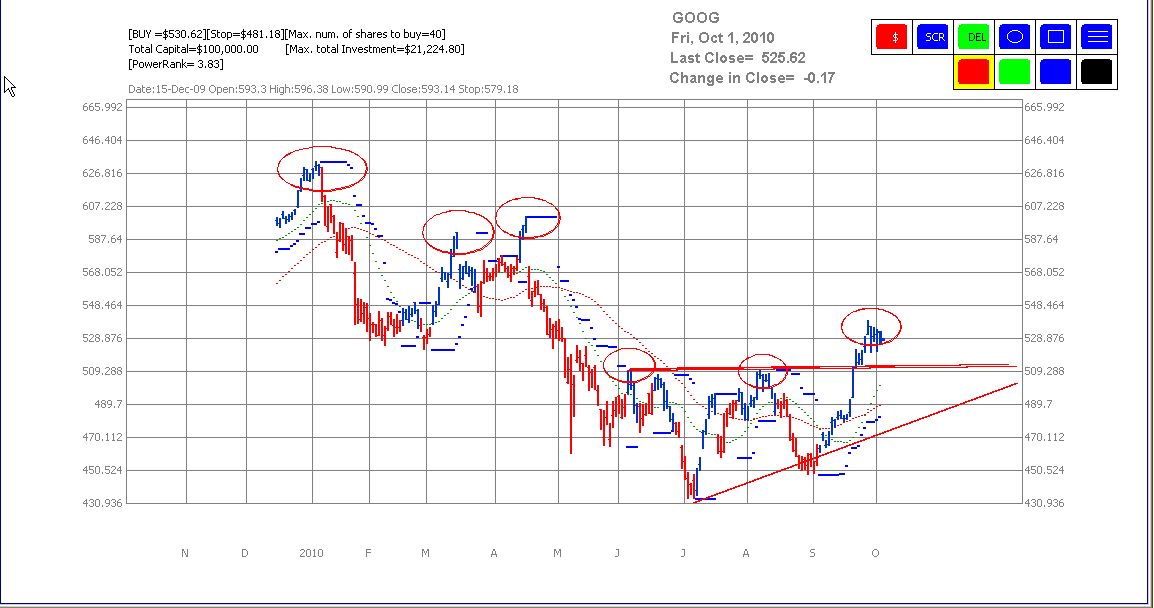
6. Fibonacci Rectangle tool
This tool is used to draw the Fibonacci Rectangle extensions to identify the important support and resistance level.
This is a rather messy process, but bear with me.
The Fibonacci levels are 38%, 50% and 62%.
We use this tool to find out the support and resistance points in a chart. Let us see how to use this tool.
First using the circle tool, circle the peaks and valleys of the stock chart.

Here, I have circled the peaks in red color and the valleys in green color.
Next, click on the Fibonacci Rectangle tool. Then click on a peak and then drag the mouse to the lower right hand side till it reaches one of the valleys.
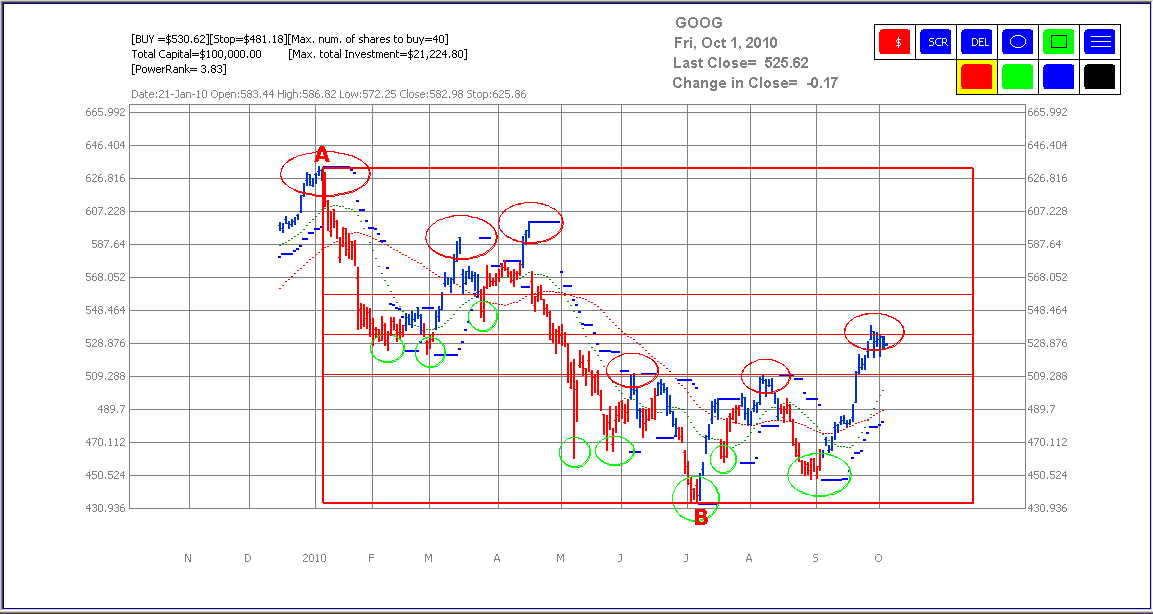
Here, I have selected the peak near point A and dragged the mouse to lower right hand side till it reached the same level as point B which is a valley.
Now, select another peak and draw a Fibonacci rectangle to another bottom.
Keep selecting different peaks and different bottoms and draw rectangles.
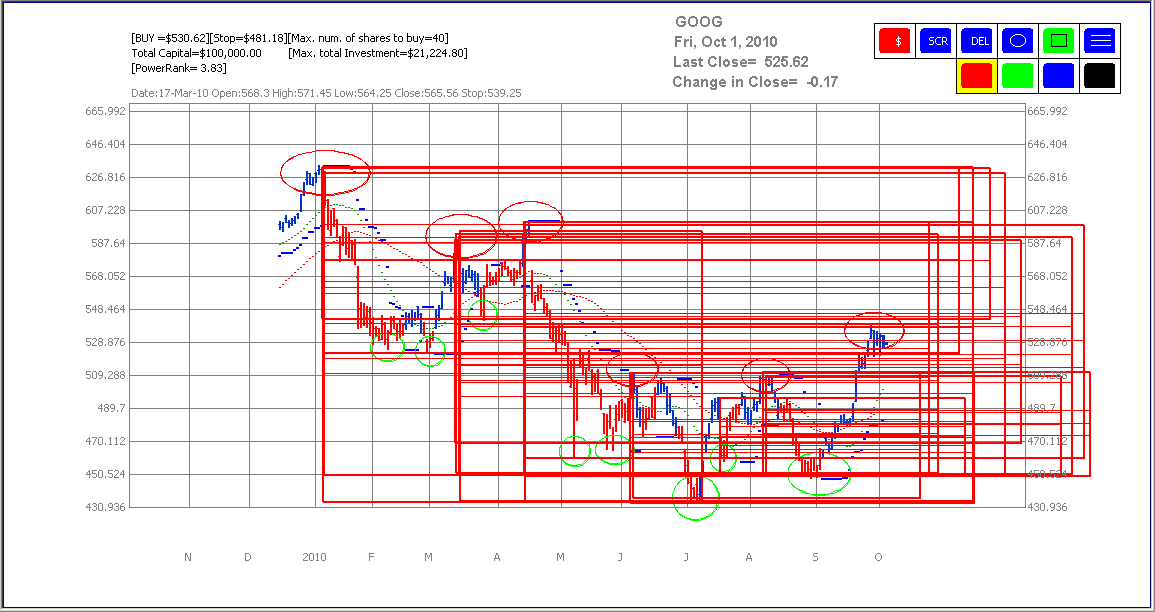
The chart will become very messy. Do not worry. That is exactly the point of this exercise.
After you have drawn many rectangles, look at the chart closely.
You will notice that there are some areas where the lines are concentrated. There are many lines around this ares. Some areas have so many lines that the lines appear combines as a thick line.
These areas are the Fibonacci areas of resistance and support.
These are the areas where the stock would face resistance if it has reached upto that point, or have support if the price is above those areas.
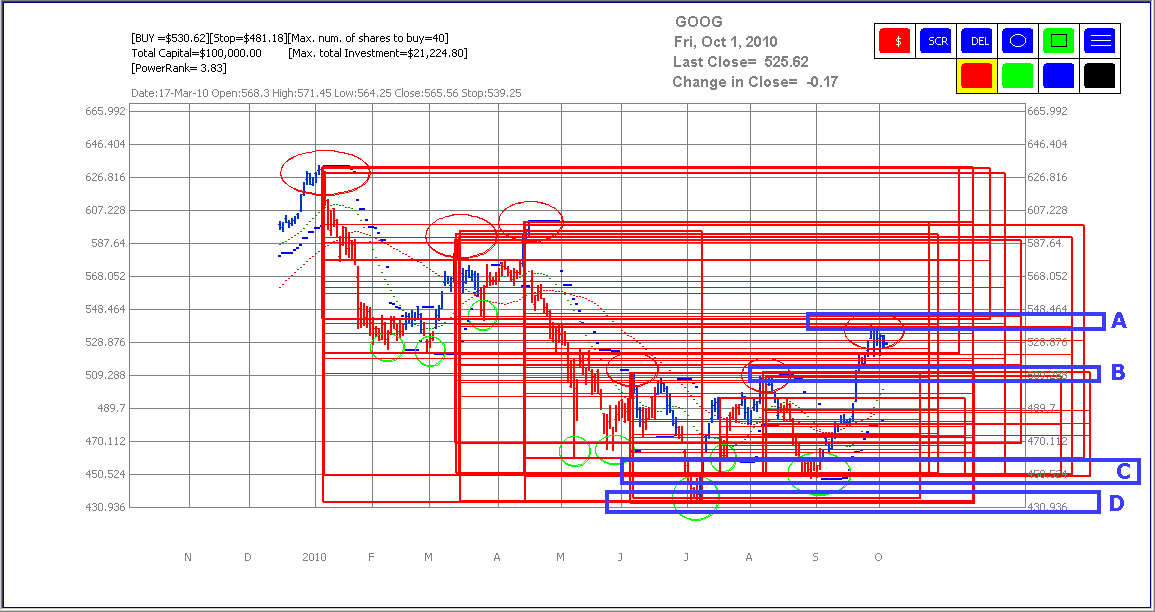
The points A, B, C and D show those areas where the lines are concentrated or have consolidated into a thick red line.
These points are the important support and resistance levels.